Best Horse Racing Betting Sites – Bet on Horse Racing in 2026
Loading...
A race does not start fair just because the horses are level at the stalls. At many British racecourses, the advantage hidden in the racecard — the stall number, the distance, the prevailing ground conditions — can determine the result before the race has even begun. Track bias is the systematic advantage that certain positions, distances, or ground conditions confer at specific courses, and it is one of the most underused analytical tools available to punters.
Bias exists because racecourses are not symmetrical. They have bends that favour one rail over another, straight courses where one side drains faster, and home straights where the positioning of the running rail creates an inside track that is shorter than the outside. Across all 59 racecourses in Britain, the configurations are so varied that a stall position which is a significant advantage at one course may be irrelevant at another. Understanding these course-specific biases and factoring them into your analysis is a genuine edge — and the data to identify them sits right there in the historical results.
Draw Bias: Why Stall Position Matters on Certain Courses
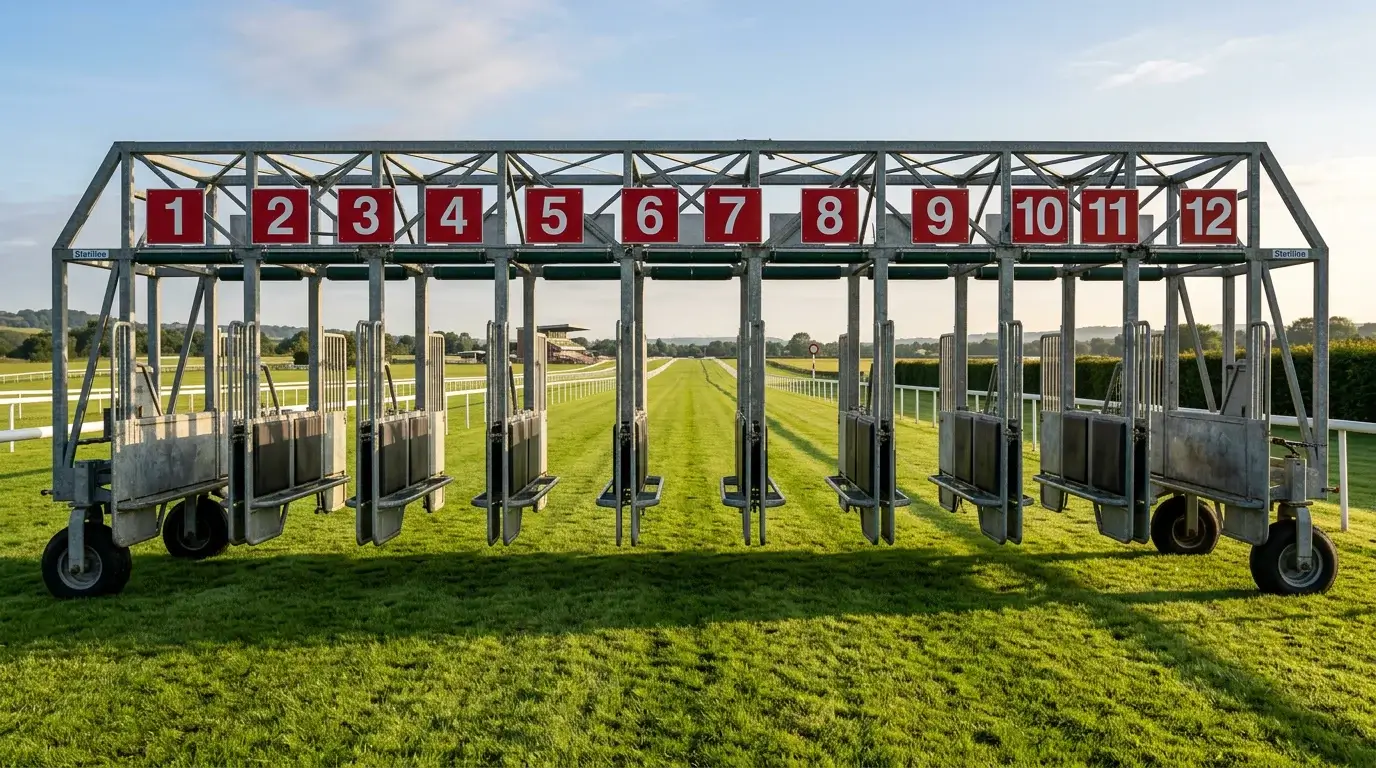
Draw bias is most relevant in Flat racing, where starting stalls assign each horse a fixed position across the track. In National Hunt racing, there are no stalls — horses line up across the course and the draw is less of a factor, though rail positioning still matters.
The draw becomes significant when the course layout creates a shorter route for horses on one side of the track. At Chester, the tight left-handed circuit means horses drawn low (near the inside rail) have less ground to cover on every bend. In sprint races at Chester, the low draw advantage is so pronounced that it overrides form in many cases: a mediocre horse drawn one can beat a better horse drawn twelve simply by saving ground on the turns. The historical results confirm this overwhelmingly.
At Beverley, the five-furlong course has a significant draw bias towards high numbers, because the track configuration and camber mean the far side of the course often rides faster. At Goodwood, the bias shifts depending on distance: the five-furlong course and the straight mile can favour different sides depending on the going and the positioning of the running rail.
Newmarket, with its wide, straight Rowley Mile, might seem immune to draw bias — but in large-field sprints, the side of the course that the field migrates towards can create a group advantage. If the far side races faster on a given day, horses drawn high and racing in that group will benefit; if the stands’ side is favoured, the low draws gain the edge. The bias is not fixed by stall number alone — it is influenced by where the jockeys choose to race, which in turn is influenced by wind direction, ground conditions, and the position of the running rail.
Ascot over the straight mile stages some of the biggest Flat handicaps of the year — the Royal Hunt Cup, the Wokingham — and the draw’s impact in those races is hotly debated. The conventional wisdom shifts from year to year, influenced by watering patterns and rail positioning, making it essential to check the most recent results at the course rather than relying on historic assumptions that may no longer hold.
Going and Distance Bias: Patterns in Historical Results
Beyond the draw, individual courses develop reputations for favouring particular running styles, distances, and ground conditions — and the historical results bear those reputations out.
Going bias describes the tendency for certain courses to ride faster or slower than the declared going suggests. A course with excellent drainage may ride genuinely Good when the official description says Good to Soft, giving an advantage to horses that prefer faster ground. Conversely, a course that holds water may ride heavier than declared, catching out punters who took the going at face value. These biases are course-specific and often persist across seasons, creating a reliable pattern in the results for those who track them.
With approximately 60% of Britain’s annual races run on the Flat and 40% over jumps — a split confirmed by industry data — the going bias operates differently between the two codes. Flat racing tends to take place on better ground, with courses watering to avoid extremes, while jump racing contends with the full range from good to heavy through the winter. The result is that going bias on the Flat is often about subtle differences within a narrow range (Good versus Good to Firm), while in jump racing it can involve stark contrasts (Soft versus Heavy) that dramatically alter race outcomes.
Distance bias refers to courses where certain distances consistently produce unrepresentative form. A classic example is the five-furlong sprint at a sharp, tight track: the race may be over before the horses have time to settle, giving front-runners a disproportionate advantage. At the other end, a three-mile chase at a flat, galloping track may produce different results from the same distance at a stiff, undulating course, because the physical demands are so different. Knowing which distances at which courses produce reliable form — and which produce results skewed by course characteristics — helps the analyst weight their data appropriately.
How to Factor Track Bias Into Your Analysis
The practical application of track bias data follows a simple framework: check the bias before the race, not after.
Before assessing any race, look at the course and distance. Is there a known draw bias for that configuration? If so, check which stall your horse has been allocated. A horse drawn badly at a course with a strong bias needs to overcome a structural disadvantage that no amount of ability can fully compensate for. Factor it in — either by downgrading the horse’s chance or by adjusting the price at which you would be willing to back it.
Next, check the going and cross-reference it against the course’s going bias history. If the declared going is Good to Soft but the course traditionally rides on the quicker side of that description, adjust your expectations for horses with going preferences. A horse that needs genuine soft ground may not get it even though the official going appears to suit.
Finally, look at the results from earlier on the same card. On a raceday, bias can develop as the ground is used. If the first three races have all been won by front-runners racing on the rail, that pattern is likely to continue — and a horse in the fourth race that needs to come from behind may be fighting a bias that has been confirmed by the day’s evidence. Updating your bias assessment race by race is a level of analytical discipline that most punters skip, and the results often reward those who do not.
Track bias is not a guaranteed winner-finder. It is a filter — one that narrows the field, identifies horses that are advantaged or disadvantaged by factors beyond their control, and adjusts your probability assessments to reflect the reality of the course rather than the theoretical equality of the form book. In a sport where margins are measured in lengths and noses, an edge of even a few percentage points can make the difference between a profitable season and a losing one. The bias data is in the results. The advantage goes to those who look for it.