
Best Horse Racing Betting Sites – Bet on Horse Racing in 2026
Loading...
A race result tells you who won, by how far, and at what price. It does not tell you how fast the winner was travelling at the two-furlong pole, whether the horse that finished fourth was running the fastest final section of any runner in the field, or whether the early pace was genuinely strong or deceptively slow. Sectional times fill that gap — the next layer of race result data that breaks a race into segments and reveals what happened within the race, not just at the end of it.
BHA chief executive Brant Dunshea has identified a growing hunger for data among racing consumers and bettors alike. Sectional times are the sharpest expression of that desire: granular, objective, and capable of revealing truths that finishing positions and in-running comments cannot. As the technology improves and the coverage expands, sectional data is moving from niche analytical tool to mainstream component of the race result.
What Are Sectional Times and Why They Matter
Sectional times divide a race into segments — typically measured furlong by furlong, or in larger sections of two or three furlongs — and record how fast each horse covered each segment. The simplest version gives you the overall time for the final two furlongs; the most detailed gives you a furlong-by-furlong breakdown for every runner in the field.
Why does this matter? Because the overall winning time tells you surprisingly little about the quality of a performance. A horse that wins a mile race in 1 minute 38 seconds has produced a headline figure, but that number conceals the story. Did the horse lead from the front at a strong pace and maintain it to the finish? Or did it crawl through the first six furlongs in a slowly run race and sprint the final two? The winning time is the same, but the performances are fundamentally different — and their predictive value for future races differs accordingly.
Sectional times expose this distinction. A horse that ran its final two furlongs in 22.5 seconds in a strongly-run race has produced a more impressive performance than one that ran the same closing sectional in a slowly-run affair, because the first horse was already under pressure when it accelerated. The sectional data, combined with the pace of the early sections, allows analysts to adjust for pace and produce a more accurate assessment of each horse’s true ability.
The audience for this level of data is larger than racing traditionalists might assume. BHA research through Project Beacon identified over 25 million people in Britain open to engaging with racing, many of them from a generation accustomed to the granular statistics available in football, cricket, and American sports. For those potential fans, sectional times offer the kind of analytical depth that makes a sport intellectually engaging beyond the visceral thrill of the finish.
Providers: TurfTrax, Total Performance Data and Racecourse Coverage
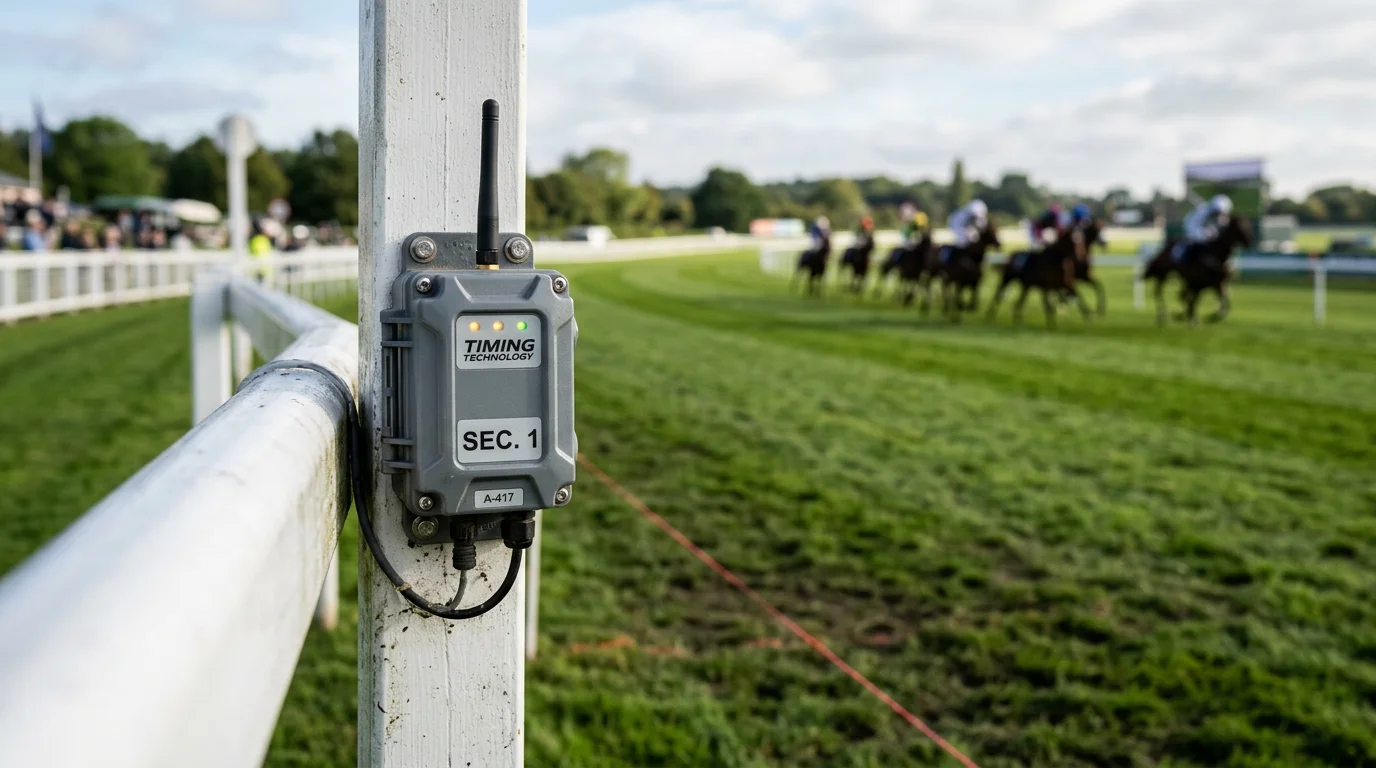
Sectional timing in British racing is provided by specialist technology companies that install GPS tracking and timing infrastructure at racecourses. The two principal providers are TurfTrax and Total Performance Data (TPD), each with their own technology and coverage footprint.
TurfTrax has been the longest-established provider of sectional timing in Britain. Its system uses GPS transponders worn by each horse, tracking position and speed throughout the race. TurfTrax data has been integrated into Racing Post’s results pages and is available to subscribers, providing furlong-by-furlong splits for races at courses equipped with the technology.
Total Performance Data (TPD) is a newer entrant that has expanded coverage significantly. TPD’s system captures not just sectional times but stride frequency and stride length data, offering a biomechanical layer on top of the basic timing information. This additional data is particularly valuable for identifying horses that are suited to faster or slower surfaces, and for detecting subtle changes in a horse’s action that may indicate improving or declining fitness.
Coverage is not universal. Not all British racecourses are equipped with sectional timing technology, and the quality and granularity of data varies between venues. The major Flat courses — Newmarket, Ascot, York, Goodwood — tend to have the best coverage, reflecting both the commercial demand for data at high-profile meetings and the investment required to install and maintain the equipment. The same operational precision that delivers 82.2% off-time punctuality across British racing is gradually extending to timing infrastructure, but the process is incremental.
For the form analyst, the practical implication is that sectional data is available for some races but not all. When it is available, it adds a powerful dimension to results analysis; when it is not, traditional methods — finishing distances, in-running comments, visual replay assessment — remain the primary tools. The direction of travel, however, is clear: coverage is expanding, and the day when sectional times are a standard component of every British race result is approaching.
The Future: AI, Stride Analysis and Real-Time Dashboards
The technology behind sectional times is evolving rapidly, and the next generation of race result data will look very different from the current format.
Artificial intelligence is already being applied to racing data, with machine-learning models trained on historical sectional times, finishing positions, going data, and market information to generate probability assessments for future races. These models do not replace human judgement — the variables in horse racing are too numerous and too interdependent for any model to capture completely — but they provide a quantitative baseline against which human analysis can be tested and refined.
Stride analysis takes sectional timing to the biomechanical level. By measuring stride length and frequency at different points in a race, analysts can identify whether a horse is maintaining its stride pattern (a sign of sustained fitness) or shortening its stride (a sign of fatigue or discomfort). This data has obvious applications for trainers monitoring their horses’ condition, but it is also increasingly available to the analytical public, adding another dimension to post-race assessment.
Real-time dashboards represent the ultimate destination for this technology: live displays during the race that show each horse’s speed, position, and sectional splits as the action unfolds. The technology exists — it is used in some form in American racing and in other sports — but implementation in British racing has been cautious, partly due to cost and partly due to concerns about information overload for a traditional audience.
Brant Dunshea has described the racing market as having vast, untapped potential for growth. Technology — sectional times, stride analysis, AI-driven insights, and real-time data — is one of the keys to unlocking that potential. The parallels with other sports are instructive: football’s adoption of expected-goals models, cricket’s embrace of ball-tracking data, and tennis’s use of Hawk-Eye have all deepened fan engagement and created new analytical communities around those sports. Racing is arriving later to this party, but the raw data it generates — thousands of races, tens of thousands of runners, measurable performances under varying conditions — makes it ideally suited to the kind of statistical analysis that thrives in the digital age.
For the form analyst, the message is straightforward: the results of the future will contain more data than ever before, and the ability to read and use that data will separate the informed punter from the crowd. Sectional times are not the end of this evolution; they are the beginning.